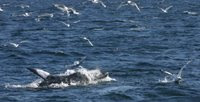
So I diverge a little. We cover a big spring tide and a small neap tide, so we should be able to see the contrast between the tides in the physics (we expect stronger & bigger internal waves at springs & lower at neaps), and in the biology (I’d probably expect there to be more surface feeding by seabirds during springs because the internal waves push the food to the surface – but I could be proven wrong). So, we chose a nice productive bank – Jones Bank (see map in previous blog) to look at these internal waves, and the associated physics & biology in three locations: on top of the bank (MS1), on the middle of the slope of the bank (MS2) and on the bottom of the bank (MS3). We also have a control site south of the bank by a few miles in a flat area (MS4) where we don’t expect the abrupt dramatic internal waves we’ve already seen on the bank edge (just some slow gentle internal waves).
So as part of this we do 25 hour stationary monitoring both on the bank and at the flat control site, taking regular measurements of turbulence through the water column (we expect more turbulence in internal waves, at thermocline boundaries etc.), plus a range of other variables through the water column: temperature, salinity, nutrients, dissolved oxygen, bacteria, phytoplankton, zooplankton (see previous blog), and probably other stuff that I haven’t found out about yet! In these sites we also take samples of the sediment, so that we can look at interchange of nutrients between the sediment & the water column & see if the internal waves have any effect on the productivity of the bottom, and therefore of course what critters are living in the sediment (so far it’s been sand or muddy sand at the bottom). We also have a camera that takes photos of the fish at the seabed (more of that later), and we also collect fisheries acoustics data & carry out visual watches for birds & cetaceans. These stations are carried out on the bank at spring & neap tides, and at the control site.
Then we have the ‘boxes’ (described yesterday) – surveying an oval 12 times over a 25 hour period, measuring oceanography (the temperature & salinity through the water column), fish & seabirds/marine mammals (if we ever see any of the latter). We’ll do these boxes on the bank both at spring & neaps, and at the control site.
One final activity is the dye release – but that’s in progress now, and quite cool… so I’ll concentrate on that in tomorrows blog :o)
 ...since there are no photos for todays blog I thought I'd put in a photo of the sunset I took yesterday...


No comments:
Post a Comment